Form Debugger
Form Debugger is a form testing, reviewing, and troubleshooting tool. To open the Form Debugger, create/open a solution, run a form, and press Ctrl + Shift + F12.
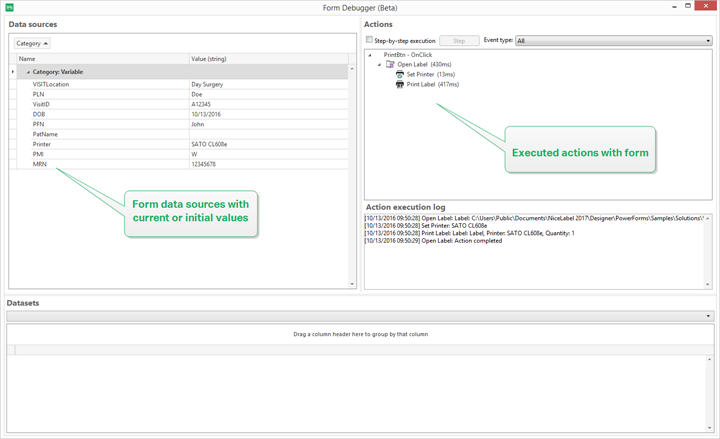
Data sources area provides an overview of the data sources which are used by form objects.
Category: sorts data source categories (database fields, variables, functions). By default, the connected data sources are grouped by this column.
Name: data source name.
Value (string): string representation of data source value. This field is editable.
Actions area lists the currently executing (or last executed) set of actions. The currently executing action is marked with green color. After an action is executed, the area also displays its execution time.
Step-by-step execution: makes the Form Debugger stop before an action is executed.
Step button: executes an action that the Form Debugger has stopped at.
Event type: allows you to filter the events according to their origin. The events can be either started by:
user action (click, enter the object, mouse hover, etc.)
automatically (using timer)
Action execution log field lists the details of executed actions. These actions are listed using the following format: [date time] action name value/string.
Datasets lists the tables loaded by form. Select a table to display the data it contains.
Note
Form Debugger is not available in production environments. It can only be run during the solution development with enabled have read/write access to the solution file.
Tip
Form Debugger also allows you to debug the form startup actions. To do so, run the debugger while designing the form. Press Crtl + Shift + R. The form and Form Debugger will open simultaneously.